Non-Functional Testing Maturity Model:
A 6-Dimension Framework
A practical framework for assessing and improving non-functional testing capability across strategy, people, data, tooling, communication, and culture. Built from 25 years of engagements across finance, retail, government, utilities, and entertainment.
Most performance testing is theatre. Teams run load tests against round numbers, report green dashboards, and move on. Nobody asks whether the test simulated anything resembling real traffic. Nobody asks because nobody defined what real traffic looks like. The load profile was skipped, and everything downstream is unanchored. I wrote separately about why load profiling is the single most critical non-functional requirement. See: Load Profiling Foundation This article addresses the broader question: how do you assess and improve the entire capability that surrounds it?
Why Capability Matters More Than Tools
Organisations buy performance testing tools and expect results. They hire a specialist, hand them a license, and wait for green dashboards. When the specialist leaves, the capability leaves with them.
This is a tools-first approach, and it fails because tools are the smallest part of the picture. A mature non-functional testing capability spans Strategy and Governance, People and Process, Data and Environments, Tooling and Observability, Communication and Knowledge, and Culture and Innovation. Tools sit inside that structure. Without the structure, the best tool in the world collects dust.
I have assessed and rebuilt non-functional testing programmes for over 25 years across finance, retail, government, utilities, and entertainment. The pattern repeats: the organisations that sustain quality treat it as a capability, investing in the system around the tools.
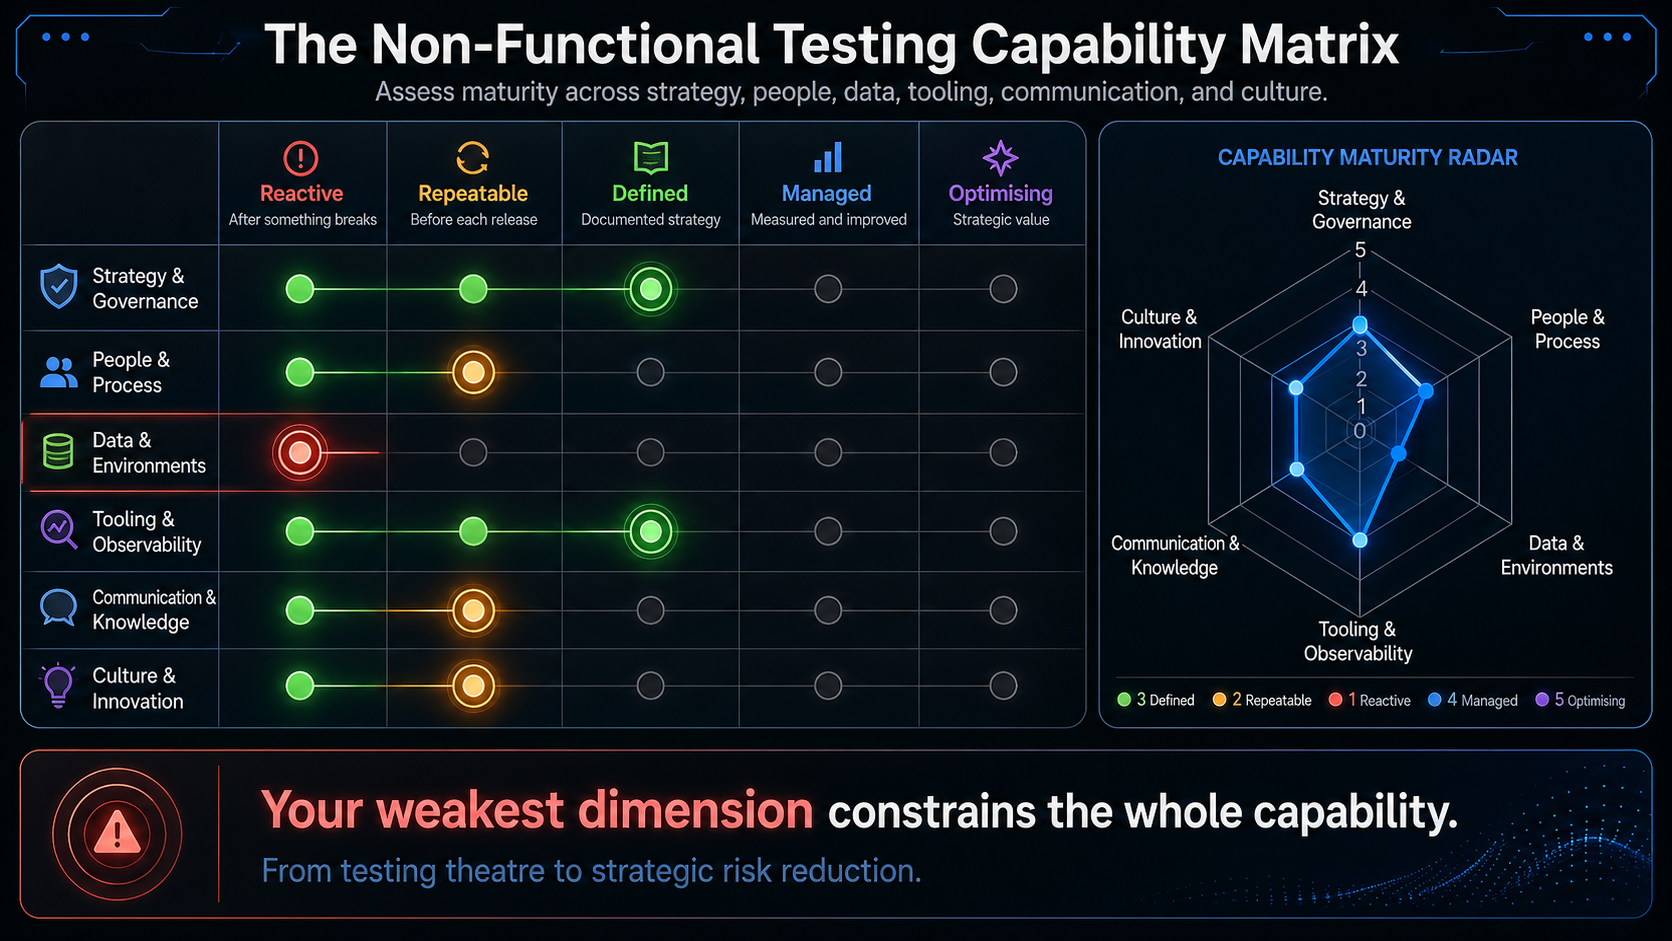
The model below draws from those engagements. It gives you a way to self-assess, prioritise improvements, and track progress. It is organised around six assessment dimensions evaluated across five maturity levels, producing a matrix that reveals exactly where your capability is strong and where it breaks down.
The Assessment Framework
The framework evaluates capability across six dimensions:
- Strategy and Governance: alignment to business objectives, NFR ownership, traceability
- People and Process: skills breadth and adaptability, documented methodology, load profiling as the starting discipline, risk-proportionate approach
- Data and Environments: two types of data (test driver data and system data), volume testing, perishable data management, environment representativeness, evidence-based load profiles
- Tooling and Observability: protocol-appropriate tool selection, CI integration, observability from metrics through distributed tracing to AI-assisted analysis, bespoke capability development
- Communication and Knowledge: quality over quantity, dashboards for instant management attention, leadership in stakeholder communication, live templates integrated to workflow
- Culture and Innovation: shift-left mentality with realistic expectations, risk reduction as purpose, improvement allocation, cross-silo collaboration, experimentation
Each dimension is scored across five maturity levels:
| Level | Name | In One Sentence |
|---|---|---|
| 1 | Reactive | Testing happens after something breaks |
| 2 | Repeatable | Testing happens before each release |
| 3 | Defined | Testing follows a documented strategy |
| 4 | Managed | The team measures and improves its own capability |
| 5 | Optimising | The capability generates strategic value and sustains itself |
Most organisations are not at a uniform level. You might have Level 3 process maturity but Level 1 data management. That unevenness is normal and revealing. The dimension that scores lowest is usually the one blocking progress everywhere else.
The Capability Matrix
| Dimension | Level 1: Reactive | Level 2: Repeatable | Level 3: Defined | Level 4: Managed | Level 5: Optimising |
|---|---|---|---|---|---|
| Strategy & Governance | No NFR ownership. Testing triggered by incidents. No traceability from requirement to result. | NFRs documented for major systems, often incomplete or inherited. One person owns the testing activity. No link to business risk register. | Testing strategy aligned to business objectives. NFRs reviewed during design. Traceability from requirement to test to result. Senior leadership allocates budget. | Strategy feeds from production metrics. Risk assessment is formalised and proportional. Internal and external assurance capability. NFRs appear in supplier contracts. | Strategy aligns to business strategy. Capacity planning accounts for market shifts, seasonal patterns, and growth. Full lifecycle integration from procurement through production monitoring. NFRs enforceable through SLAs, measured via SLIs and SLOs. |
| People & Process | No dedicated resource. A developer picks it up when asked. No methodology. No load profile exists. | Dedicated tester or allocated time. Basic scripts cover primary journeys. Tests run on schedule against arbitrary concurrency numbers. The methodology is implicit: run the script, check the numbers. | Documented methodology starting with load profiling: how many users, doing what, over what period, with what safety margin. Risk-proportionate approach tailors effort to each system. Breadth beyond performance into resilience, scalability, reliability. | Production data drives load profiles. Self-serve capability lets developers run predefined scenarios. 20 to 30% of capacity allocated to improvement. The team can audit supplier approaches. | AI accelerates script generation, dynamic value correlation, and root cause analysis. Humans direct strategy. Chaos engineering and failure injection are systematic. The practice continues at full capability regardless of staff turnover. |
| Data & Environments | Hardcoded test data. Single test account. System database holds a handful of rows while production holds millions. No environment strategy. The team cannot describe what peak load looks like. | Manual data refresh before each run. System data is token: a fraction of production volume, masking indexing and query performance issues. Test environment exists but may not match production topology. Load profiles, if they exist, are based on guesswork. | Two data concerns managed separately: test driver data and system data. Volume testing validates data impact even at single-user load. Perishable data provisioned in sufficient quantity and variety. Thread-safe data management. Environments representative of production. Load profiles grounded in evidence. | Production data feeds load profile development: real transaction mixes, observed peak concurrency, seasonal patterns, growth trends. Data generation automated with lifecycle management. Dedicated data management systems with UI, pipeline integration, and automated governance. Environment provisioning on demand. | Continuous environment validation against production. Data strategies evolve through feedback loops. The test answers not just "does it pass?" but "how much headroom before failure?" and "what does failure look like?" and "where is the bottleneck, and what would alleviating it cost?" |
| Tooling & Observability | Ad hoc tooling. Someone downloaded JMeter once. Scripts live on a laptop. No monitoring beyond what was already in place. | Scripts in version control. Basic execution with manual triggering. Some APM in place but not correlated with test activity. One tool for everything regardless of protocol or problem. | Protocol-appropriate tool selection from a maintained arsenal. Monitoring covers all components with metrics captured with enough history and granularity. The team correlates test activity with application metrics in real time. | CI/CD-triggered tests gate deployments. Distributed tracing configured to trace time through the architecture. Distributed execution. Self-serve scenarios. Teams extend existing tools with plugins, wrappers, and integrations. The team distinguishes failures in the application, infrastructure, network, or the test itself. | Automated environment discovery, anomaly detection, and AI-assisted deep-dive analysis. AI accelerates script generation, dynamic value correlation, and root cause analysis. Innovation in tooling is systematic, funded, and practitioner-led. Teams build new capabilities from scratch. |
| Communication & Knowledge | No formal reporting. Results shared verbally or not at all. Knowledge lives in one person's head. | Technical reports: response times, throughput, error rates. Decision-makers receive raw numbers without business context. Scripts in source control but no runbooks or templates. | Quality over quantity. If it is green, show the green and confirm what passed. Live dashboards bring management attention to the areas that need it most. Runbooks, templates, and architecture packs are shared. | Automated, centralised reporting integrated into existing business workflows. Interactive dashboards and live documents replace static reports. Trend analysis and forecasting in regular capability reports. Leadership communicates key issues with enough supporting evidence, in a management-friendly way. Knowledge base actively maintained. | Quarterly capability reports to the board. Self-improving documentation through continuous feedback loops. Templates are live, interactive, and integrated into the delivery workflow. Knowledge management sustains capability independent of any individual. |
| Culture & Innovation | No awareness of non-functional risk as a discipline. Testing is a reaction to failure. | Awareness exists but testing is mechanical. No dedicated improvement time. Performance testing sits in isolation from other quality disciplines. | Leadership understands the value. Teams collaborate on shared risk. Some improvement time allocated. Shift-left thinking begins, though full CI/CD-integrated performance testing remains aspirational. | 20 to 30% improvement allocation is protected. Cross-silo collaboration is the norm. Innovation is funded and encouraged. The risk-appropriate response evolves: increasing capability and ease of testing mitigates more risk more often. | Continuous improvement is a permanent line item. Teams experiment, share findings, and adopt improvements without waiting for mandates. Tools and processes approach the continuous testing ideal. The culture sustains capability even when leadership changes. |
Dimension Deep-Dives
Strategy and Governance
This dimension answers: does testing connect to business objectives, and who is accountable for non-functional risk?
At Level 1, nobody owns non-functional requirements. Testing happens because something broke or because an auditor asked. There is no traceability. By Level 3, each test traces back to a documented requirement, and those requirements map to the risk register. The journey from Level 1 to Level 2 often starts with a single question: who is accountable when a system fails to meet its performance targets? Assigning that ownership, even to someone carrying it as 20% of their role, changes the dynamic.
At higher levels, governance extends into commercial and legal territory. NFRs appear in supplier contracts before signing, enforceable through SLAs and measured operationally via SLIs and SLOs. If a third party hosts or builds your system, the contract should specify performance expectations in testable terms.
A retail company launched a Black Friday campaign without load testing. The payment gateway timed out under peak traffic, costing significant revenue over four hours. The CTO asked for a performance test plan. A contractor arrived, built scripts, found the bottleneck, and left. Nobody asked the first question: what does peak load actually look like? The contractor tested against round numbers. Six months later, the team could not re-run the tests because the contractor's machine held the only copy of the scripts. No ownership, no traceability, no strategy. Level 1.
Can you explain, in business terms, why you run each performance test? Can you trace each test back to a documented requirement? If not, start there.
People and Process
This dimension answers: does the team have the skills and methodology to produce meaningful results?
The methodology question is where the load profiling dependency bites hardest. Most performance testing fails because the team jumps to execution without defining what it is simulating. A documented methodology must start with load profiling: how many users, doing what transactions, over what period, with what safety margin. Without that foundation, every subsequent step is unanchored. The team generates data, not evidence.
At Level 2, a team runs tests on schedule but against arbitrary concurrency numbers. The jump to Level 3 requires that the methodology starts with the load profile and tailors the testing response to each system's risk profile. A payment gateway protecting revenue gets deeper scrutiny than an internal reporting tool. This proportionality prevents the common failure mode where every system gets the same template regardless of risk.
When success criteria do not exist, the methodology should include a process for proposing them based on user tolerance thresholds, business risk appetite, and competitive benchmarks. Success criteria also develop iteratively: benchmarking against a pre-change baseline is a legitimate starting point that often leads to the harder conversation about absolute targets. See: Load Profiling Foundation
A government digital service team runs a JMeter suite before every release. The tester inherited the scripts from a previous contractor. Results go into a spreadsheet. The delivery manager asks "are we OK?" and the tester says yes or no. The team has no visibility into why a test failed and no way to predict capacity needs for an upcoming policy change that will spike traffic. They test, but they do not know what they are testing against. The jump to Level 3 requires answering that question first.
Does your methodology start with load profiling? Can your team describe peak load in specific terms: user count, transaction mix, duration, safety margin? If not, the methodology has a gap at its foundation. See: Load Profiling Foundation
Data and Environments
This dimension answers: does the test produce evidence about the real system, or about an idealised version of it?
There are two distinct data concerns, and conflating them is a common mistake:
- Test driver data is the parameterised input that drives virtual user flows: usernames, search terms, product IDs, payment details. This data must be varied and production-like in size, complexity, and structure. Every virtual user logging in as testuser01 and searching for the same product creates an artificial happy path. The database query plan, cache behaviour, and session management are all optimised for that single path. In production, a thousand users hit a thousand different paths.
- System data is the background content that makes the application behave realistically: database tables populated to production volumes, caches primed with representative content, historical records that influence query plans and indexing behaviour. A database with 1,000 rows when production holds 50 million tells you nothing about query performance at scale.
Both types matter. The more realism you have in both, the better your chances of flushing out the defects that will surface in production. When in doubt, err on the side of caution and go heavy on your data setup.
This is why volume testing deserves explicit attention. Even without a load profile, even at single-user concurrency, adding realistic data volumes can significantly impact performance. Poorly designed systems expose themselves immediately: missing indexes, queries pulling back entire tables when they needed a single row, full-table scans triggered by data patterns that only appear at scale. Volume testing catches these before you add the complexity of concurrent load.
Perishable data (values that expire during a test run, such as session tokens, one-time passwords, or time-bounded vouchers) introduces a further layer. A 4-hour soak test will fail halfway through if the test data strategy does not account for token expiry. The critical requirement is provisioning perishable data in enough quantity and variety to replay the worst-case test suite in full. An endurance test that exhausts its one-time-use data at hour two of a twelve-hour run tells you about your data strategy, not your system.
Data management becomes critical when using tools with weak built-in support. JMeter, for example, is notoriously poor at thread-safe data management. Teams often need to handcraft bespoke utilities: a live queuing system that provisions data to virtual users on demand, handles thread safety, supports rotation and cleanup, and integrates into the execution pipeline. At higher maturity levels, these systems have their own UI, lifecycle management (automated provisioning, garbage collection, replenishment), and pipeline integration.
Data privacy adds a non-negotiable constraint. Production-representative data in non-production environments means handling real customer information, transaction histories, and personal details. GDPR and equivalent regulations require data masking or anonymisation before that data leaves the production boundary. Teams that skip this step are not just taking a compliance risk; they are one breach away from regulatory action. The masking strategy must preserve data distribution and referential integrity, otherwise you lose the realism that made production data valuable in the first place.
Environment representativeness matters equally. Testing against a single application server when production runs a load-balanced cluster of eight tells you about one server's capacity, not your system's. Common failure modes include shared test environments where another team's activity contaminates your results, configuration drift where test and production environments diverge silently over months, and topology differences where the test environment lacks the load balancers, CDNs, or WAFs that shape production traffic patterns. Any of these can produce results that are technically valid but practically meaningless.
Realism in both data and environments is what enables the harder questions that performance testing exists to answer: how much headroom do we have before things break? If they do break, how will they break? Where is the bottleneck, and what would alleviating it cost? A test with an accurate load profile run against an unrealistic environment will produce clean results and false confidence.
Do you distinguish between test driver data and system data? Is your system data at production scale? Can you provision sufficient perishable data for your worst-case test duration? Does your test environment match production topology and data volumes?
Tooling and Observability
This dimension answers: does the tooling support the full testing lifecycle, and can you diagnose failures?
Tooling is not about picking a favourite. It is about having a war chest. You do not always go to battle with the longsword; sometimes the situation calls for a battle axe or a crossbow. Teams need protocol-appropriate tools: HTTP load generators for API testing, specialised tools for WebSocket or database protocols, lower-level network tools for TCP/IP analysis. The ideal tool disappears into the infrastructure: containerised, pipeline-triggered, distributed without babysitting. At minimum, a team should have a solid arsenal so they can match the tool to the problem. At higher maturity levels, teams select freely and are quick to experiment with new capabilities.
This connects directly to people. Teams that are accepting of change and eager to develop new skills will naturally expand their tooling capability. The most mature teams build or adapt their own bespoke tools. This is a genuine sign of maturity: some companies end up creating internal tools that later become products or services used externally.
Observability is often the larger gap. At minimum, every component must be properly covered, with metrics captured with enough history and granularity to spot trends and diagnose incidents. That is the baseline. At Level 2, the team can tell you that response times exceeded the threshold but cannot tell you why. At Level 3, monitoring correlates test execution with application metrics in real time. When a test fails, the team pinpoints whether the issue sits in the application, the infrastructure, the network, or the test itself. That diagnostic capability turns a failed test from a mystery into actionable evidence.
At Level 4, distributed tracing (OpenTelemetry, AppDynamics, Dynatrace, Datadog) is properly configured so the team can trace where time is spent through the architecture. This is the difference between "the checkout is slow" and "the checkout spends 1.2 seconds waiting for the inventory service to query an unindexed table in the warehouse database."
At Level 5, automated environment discovery maps the architecture without manual documentation. Anomaly detection flags deviations before they become incidents. AI-assisted analysis performs controlled deep-dive investigations, identifying root causes and correlating patterns across distributed systems. LoadMagic reduces what took a specialist significant manual effort to under two minutes. What matters is that the time freed goes into the strategic work: risk modelling, capacity forecasting, resilience architecture.
How many tools does your team have in its arsenal, and does it select based on the problem? When a test fails, how long does root cause analysis take? Can you trace a slow transaction through the full architecture to the specific component? Is your execution triggered manually or integrated into CI?
Communication and Knowledge
This dimension answers: do the right people receive results they can act on, and does knowledge survive staff turnover?
The gap between generating results and influencing decisions is where most testing capability loses its value.
The guiding principle is quality over quantity. Automation and centralisation help, but the goal is efficiency: keeping the key decision-makers in the loop in a way that works for how the business operates and uses its existing data, tooling, infrastructure, and ways of working.
The reporting gap is the most common reason testing effort loses strategic value. Technical metrics belong in technical reports. Senior leadership needs risk summaries, trend analysis, and business impact projections. "Average response time increased 400ms" means nothing to a product owner. "Checkout takes 4.2 seconds under load, which correlates with a 12% cart abandonment increase" changes the conversation. If it is green, just show the green and confirm what passed. Do not bury stakeholders in 40 pages of data when a dashboard and a one-page summary would do more. Just the key issues and enough supporting evidence to make the point.
This is where leadership skills make a difference. Sharing with the organisation and stakeholders the key information in a management-friendly way, without patronising, is a skill that performance engineers rarely develop and almost always need. The best technical analysis in the world is worthless if it never reaches the people who can act on it, or if it reaches them in a format they cannot parse.
Dashboards deserve specific mention. A well-designed live dashboard brings management attention to the areas that need it most, quickly and effectively. At Level 3, dashboards replace static reports for real-time visibility. At Level 4, they are interactive, integrated into the delivery workflow, and updated automatically. Strong templates that are live, interactive documents or tools integrated to the pipeline make a material difference to adoption.
Knowledge management determines whether capability survives personnel changes. At Level 1, knowledge lives in one person's head. At Level 3, runbooks, templates, and architecture packs are shared and maintained. By Level 4, a coordinated knowledge base compounds investment across teams.
Do your stakeholders read and act on your reports? Is your reporting quality over quantity? Could a new team member run a test cycle within their first week using documented processes? Are your templates live and integrated, or static documents that go stale?
Culture and Innovation
This dimension answers: does the organisation invest in improving its capability, and does collaboration happen across team boundaries?
Culture is the hardest dimension to change and the one that matters most. A team with open-source JMeter and Grafana will outperform a team with six-figure enterprise licenses if the first team has clear ownership, a documented methodology, and leadership that funds improvement time.
Five cultural markers separate mature organisations from immature ones:
- Sustainability. If your most experienced performance engineer leaves tomorrow, can the team continue at the same level within a month? If the answer is no, your capability lives in a person, not a system.
- Improvement allocation. Does the team spend 100% of its time running tests, or does it protect 20 to 30% for framework improvement and innovation? Teams that spend all their time executing never improve how they execute.
- Psychological safety. Does the team feel safe reporting bad news? A performance tester who discovers the system will not handle Black Friday traffic needs to say so without fear of being shot as the messenger. If reporting a failing test is career-risky, the team will learn to avoid running tests that might fail. That is the opposite of risk reduction.
- Collaboration. Do performance, reliability, and security testing teams share findings? Do developers engage with non-functional risk during design? Silos create blind spots. The most dangerous failures happen at the boundaries between teams.
- Shift-left mentality with realistic expectations. The idea that performance testing can be fully embedded in CI/CD pipelines is appealing but, for now, partly a myth. The preparation cycle between changes is typically measured in weeks, not minutes: load profiling, data provisioning, environment setup, results analysis. That said, the direction is right. By increasing testing capability and reducing friction, teams can mitigate more risk more often, which is the ultimate goal: increased coverage. Each maturity level moves closer to this ideal, reducing the dependency on lengthy assessment cycles.
This last point deserves emphasis because it connects culture to purpose. Non-functional testing exists to reduce risk. Without the risk, you cannot justify the investment. A mature culture does not shy away from this framing; it embraces it. The conversation shifts from "can we skip the performance test?" to "how do we make it easy enough to run that we never need to ask that question?"
Culture compounds over time. Small, sustained improvements produce far greater results than a transformation programme that burns bright and fades. This is Kaizen applied to testing capability: incremental improvement as a permanent practice.
When did your team last change something about how it tests, not what it tests? What percentage of your team's time goes to improvement versus execution? Is your team moving towards more frequent, lower-friction testing, or is each test a heavy lift?
The Assessment: How I Evaluate Capability
When I assess an organisation's non-functional testing maturity, I follow four steps. The order matters.
Step 1: Understand the Risk. Before opening a single test script, I ask what the organisation is protecting (revenue, reputation, regulatory compliance, public safety) and what peak load looks like (how many users, doing what, over what period). If the organisation cannot answer the second question, it cannot design a test that answers anything useful. The risk profile and the load profile together determine the appropriate depth, breadth, and investment level.
Step 2: Assess Current Capability. I evaluate the organisation across the six dimensions in the matrix. This produces a clear picture of which specific dimensions drag the overall capability down.
Step 3: Map Constraints. Every organisation operates within constraints: budget, headcount, skills availability, political dynamics, legacy technology, regulatory requirements. A recommendation that requires 12 new hires when the budget supports two is not a strategy.
Step 4: Identify Opportunities. Quick wins first, then systemic improvements. A test data refresh script that saves two days per cycle. A reporting template that gets stakeholders reading results. A CI integration that catches regressions before staging. The quick wins buy credibility. That credibility funds the larger structural changes.
Why Culture Beats Tooling
The most common mistake I see is treating capability as a procurement problem. Buy the right tool, hire a contractor, tick the box. Tools multiply what your team can do. If your team has no strategy, no process, and no ownership, the tool multiplies zero.
Culture is difficult to change and impossible to buy. It compounds over time. Every organisation operates within constraints: limited budget, thin teams, political dynamics, legacy systems, regulatory drag. A responsible assessment works within these constraints. Recommending a 12-person Centre of Excellence to a team with budget for two is a wish list, not a strategy. The question is always: given your constraints, what is the highest-value improvement you can make? Sometimes that is a test data script that saves 40 hours per quarter. Sometimes it is a reporting template that gets the CTO reading results for the first time. Sometimes it is an AI-assisted tool that replaces the manual work your team cannot afford to hire for.
Moving Between Levels
The temptation is to jump from Level 1 to Level 5. Buy AI tools, hire consultants, announce a transformation. This fails because each level builds on the one below it. AI-assisted testing at Level 5 requires a documented methodology and automated pipeline at Levels 3 and 4. A Centre of Excellence at Level 4 requires strategic alignment at Level 3. You cannot skip the foundations.
- Assess where you are. Score each dimension in the matrix. The lowest-scoring dimension is usually the constraint.
- Target one level up. Focus on the changes that move your weakest dimensions from their current level to the next.
- Invest in the blocking constraint. If your team has good process but bad test data, fix the data. If your tooling is strong but your reporting does not reach stakeholders, fix the reporting.
- Measure and iterate. Track your own improvement metrics. Revisit the assessment quarterly.
The timeline varies. Moving from Level 1 to Level 2 can happen in weeks with the right focus. Moving from Level 3 to Level 4 often takes six to twelve months because it requires organisational change.
Assessing Your Own Capability
You do not need a consultant to start. Score each of the six dimensions on a 1 to 5 scale using the matrix above. Be honest. Involve more than one person. The gaps will be obvious.
The harder part is deciding what to do about those gaps. That is where an external perspective adds value: someone who has seen how fifty organisations handle the same problem, who knows which improvements compound and which stall.
Want a formal capability review?
If you want a formal review of your non-functional testing capability, I do this work. I assess your risk posture, evaluate current capability, map constraints, and build a plan that works within them. I have built Centres of Excellence at organisations including the Metropolitan Police and the UK Home Office, leading teams of up to 16 specialists. No tool sales. No transformation theatre. Practical improvements that stick.
Reach me at [email protected] or connect on LinkedIn.